Figure Managers
MolDynPlot includes several figure managers that build on
FigureManager
with additions specific for molecular dynamics simulation data.
CorrFigureManager
Generates one or more correlation figures to specifications in a YAML file.
-
class
moldynplot.CorrFigureManager.CorrFigureManager(*args, **kwargs)¶ Bases:
moldynplot.myplotspec.FigureManager.FigureManagerManages the generation of correlation figures.
Parameters: - defaults (string, dict, optional) – Default arguments; may be a yaml string, path to a yaml file, or a dictionary; if not provided pulled from self.defaults
- args (tuple) – Additional positional arguments
- kwargs (dict) – Additional keyword arguments
-
draw_dataset(*in_args, **in_kwargs)¶ Draws dataset
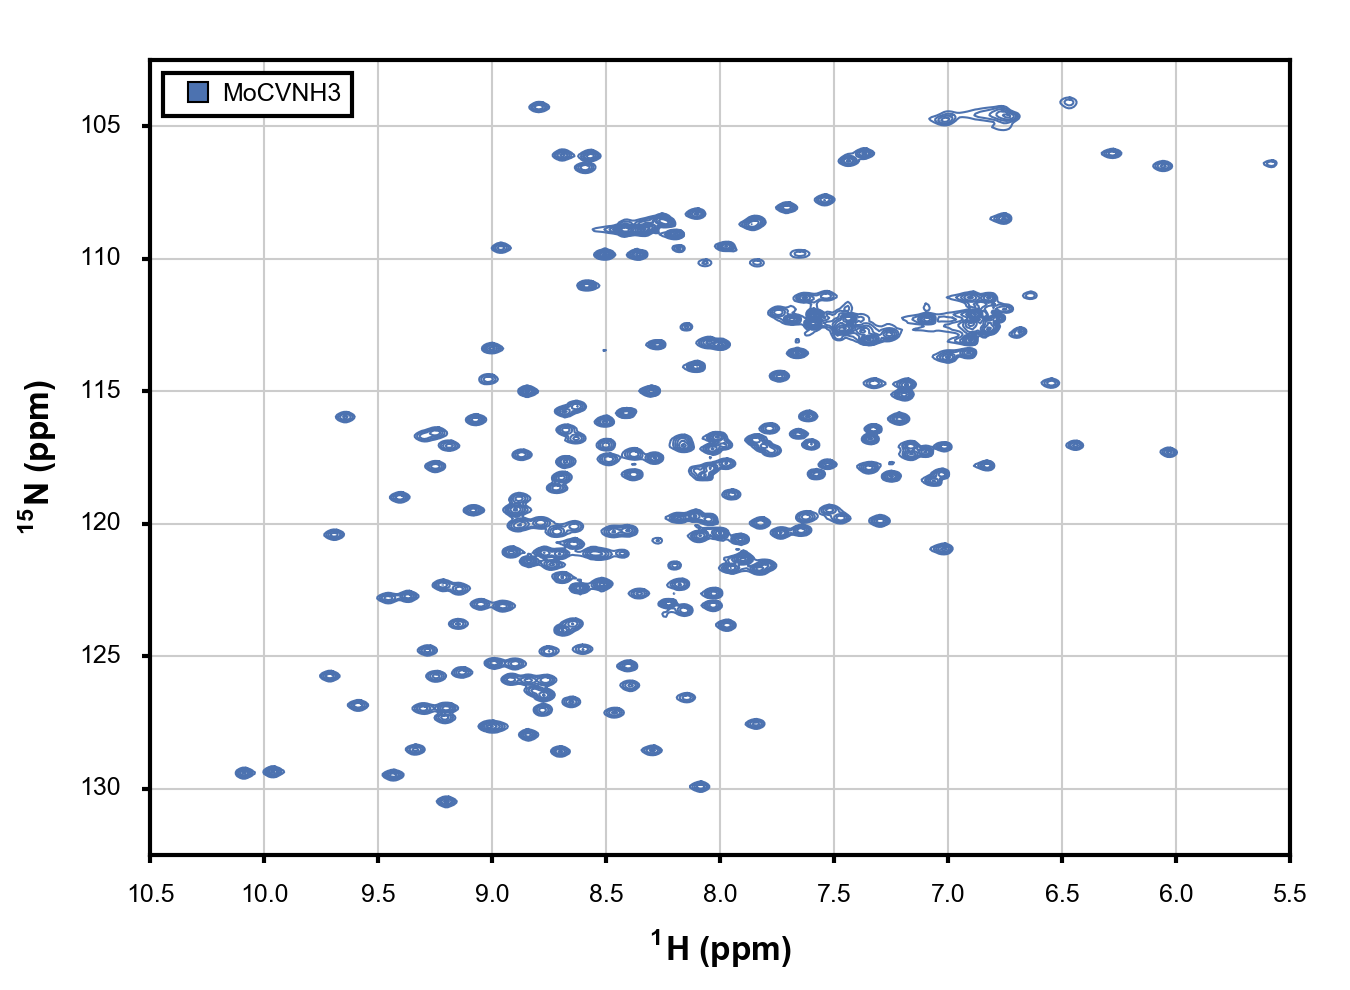
HSQCFigureManager
Generates one or more HSQC figures to specifications provided in a YAML file.
-
class
moldynplot.HSQCFigureManager.HSQCFigureManager(*args, **kwargs)¶ Bases:
moldynplot.myplotspec.FigureManager.FigureManagerManages the generation of HSQC figures.
Sample Output:
Parameters: - defaults (string, dict, optional) – Default arguments; may be a yaml string, path to a yaml file, or a dictionary; if not provided pulled from self.defaults
- args (tuple) – Additional positional arguments
- kwargs (dict) – Additional keyword arguments
-
static
get_slice(collection, lower_bound, upper_bound)¶ Extracts a slice from a collection; used to avoid plotting data outside the visible region of a figure
Parameters: - collection (ndarry) – Complete array sorted in increasing order
- lower_bound (float) – Lower bound of region to slice out; slice will start 1 below this cutoff
- upper_bound (float) – Upper bound of region to slice out; slice will start 1 above this cutoff
Returns: slice – slice
-
static
get_contour_levels(I, cutoff=0.9875, n_levels=10, min_level=None, max_level=None, **kwargs)¶ Generates contour levels.
Parameters: - I (ndarray) – Intensity
- cutoff (float) – Proportion of Intensity below minimum level
- n_levels (int) – Number of contour levels
- min_level (float) – Intensity level of lowest contour level
- max_level (float) – Intensity level of highest contour level; default = max(I)
Returns: ndarray – levels
-
draw_dataset(*in_args, **in_kwargs)¶ Draws a dataset on a subplot.
Parameters: - subplot (Axes) – Axes on which to draw
- dataset_kw (dict) – Keyword arguments used to passed to
load_dataset() - plot_kw (dict) – Keyword arguments passed to methods of
Axes - draw_contour (bool) – Draw contour
- contour_kw (dict) – Keyword arguments passed to
contourorcontourf - contour_kw[levels] (ndarray, list) – Contour levels; if
omitted; will be calculated using
get_contour_levels() - contour_kw[cmap] (LinearSegmentedColormap) – Color map used for
contours; if omitted, a uniform colormap will be generated
from contour_kw[color] using
moldynplot.myplotspec.get_cmap() - contour_kw[fill] (bool) – If true, draw filled contour levels
using
contourf; if false, draw contour lines usingcontour - handles (OrderedDict) – Nacsent collection of legend handles
- label (str) – Name to be assigned to egend handle
- handle_kw (dict) – Keyword arguments used to configure legend handle
- verbose (int) – Level of verbose output
- kwargs (dict) – Additional keyword arguments
MDGXFigureManager
Generates one or more MDGX figures to specifications provided in a YAML file.
-
class
moldynplot.MDGXFigureManager.MDGXFigureManager(*args, **kwargs)¶ Bases:
moldynplot.myplotspec.FigureManager.FigureManagerManages the generation of MDGX figures.
Parameters: - defaults (string, dict, optional) – Default arguments; may be a yaml string, path to a yaml file, or a dictionary; if not provided pulled from self.defaults
- args (tuple) – Additional positional arguments
- kwargs (dict) – Additional keyword arguments
-
draw_dataset(*in_args, **in_kwargs)
PDistFigureManager
Generates one or more probability distribution figures to specifications in a YAML file.
-
class
moldynplot.PDistFigureManager.PDistFigureManager(*args, **kwargs)¶ Bases:
moldynplot.myplotspec.FigureManager.FigureManagerManages the generation of probability distribution figures.
Parameters: - defaults (string, dict, optional) – Default arguments; may be a yaml string, path to a yaml file, or a dictionary; if not provided pulled from self.defaults
- args (tuple) – Additional positional arguments
- kwargs (dict) – Additional keyword arguments
-
draw_dataset(*in_args, **in_kwargs)¶ Loads a dataset and draws it on a subplot.
Loaded dataset should have attribute pdist_df.
Parameters: - subplot (Axes) –
Axeson which to draw - dataset_kw (dict) – Keyword arguments passed to
load_dataset - plot_kw (dict) – Keyword arguments passed to methods of
Axes - column (str) – Column within pdist_df to use
- draw_fill_between (bool) – Fill between specified region
- fill_between_kw (dict) – Keyword arguments used to configure
call to
fill_between - fill_between_kw[x] (list, ndarray) – x values passed to
fill_between - fill_between_kw[ylb] (list, ndarray) – y lower bound values
passed to
fill_between - fill_between_kw[yub] (list, ndarray) – y upper bound values
passed to
fill_between - draw_pdist (bool) – Draw probability distribution
- pdist_kw (dict) – Keyword arguments using to configure call to
plot - draw_mean (bool) – Draw point at mean value
- mean_kw (dict) – Keyword arguments used to configure call to
plot - verbose (int) – Level of verbose output
- kwargs (dict) – Additional keyword arguments
- subplot (Axes) –
SAXSFigureManager
Generates one or more time series figures to specifications in a YAML file.
-
class
moldynplot.SAXSFigureManager.SAXSFigureManager(*args, **kwargs)¶ Bases:
moldynplot.myplotspec.FigureManager.FigureManagerManages the generation of time series figures
Parameters: - defaults (string, dict, optional) – Default arguments; may be a yaml string, path to a yaml file, or a dictionary; if not provided pulled from self.defaults
- args (tuple) – Additional positional arguments
- kwargs (dict) – Additional keyword arguments
SequenceFigureManager
Generates one or more sequence figures to specifications in a YAML file.
-
class
moldynplot.SequenceFigureManager.SequenceFigureManager(*args, **kwargs)¶ Bases:
moldynplot.myplotspec.FigureManager.FigureManagerManages the generation of sequence figures.
Supported Presets:
Relaxation (
relax_4_s2):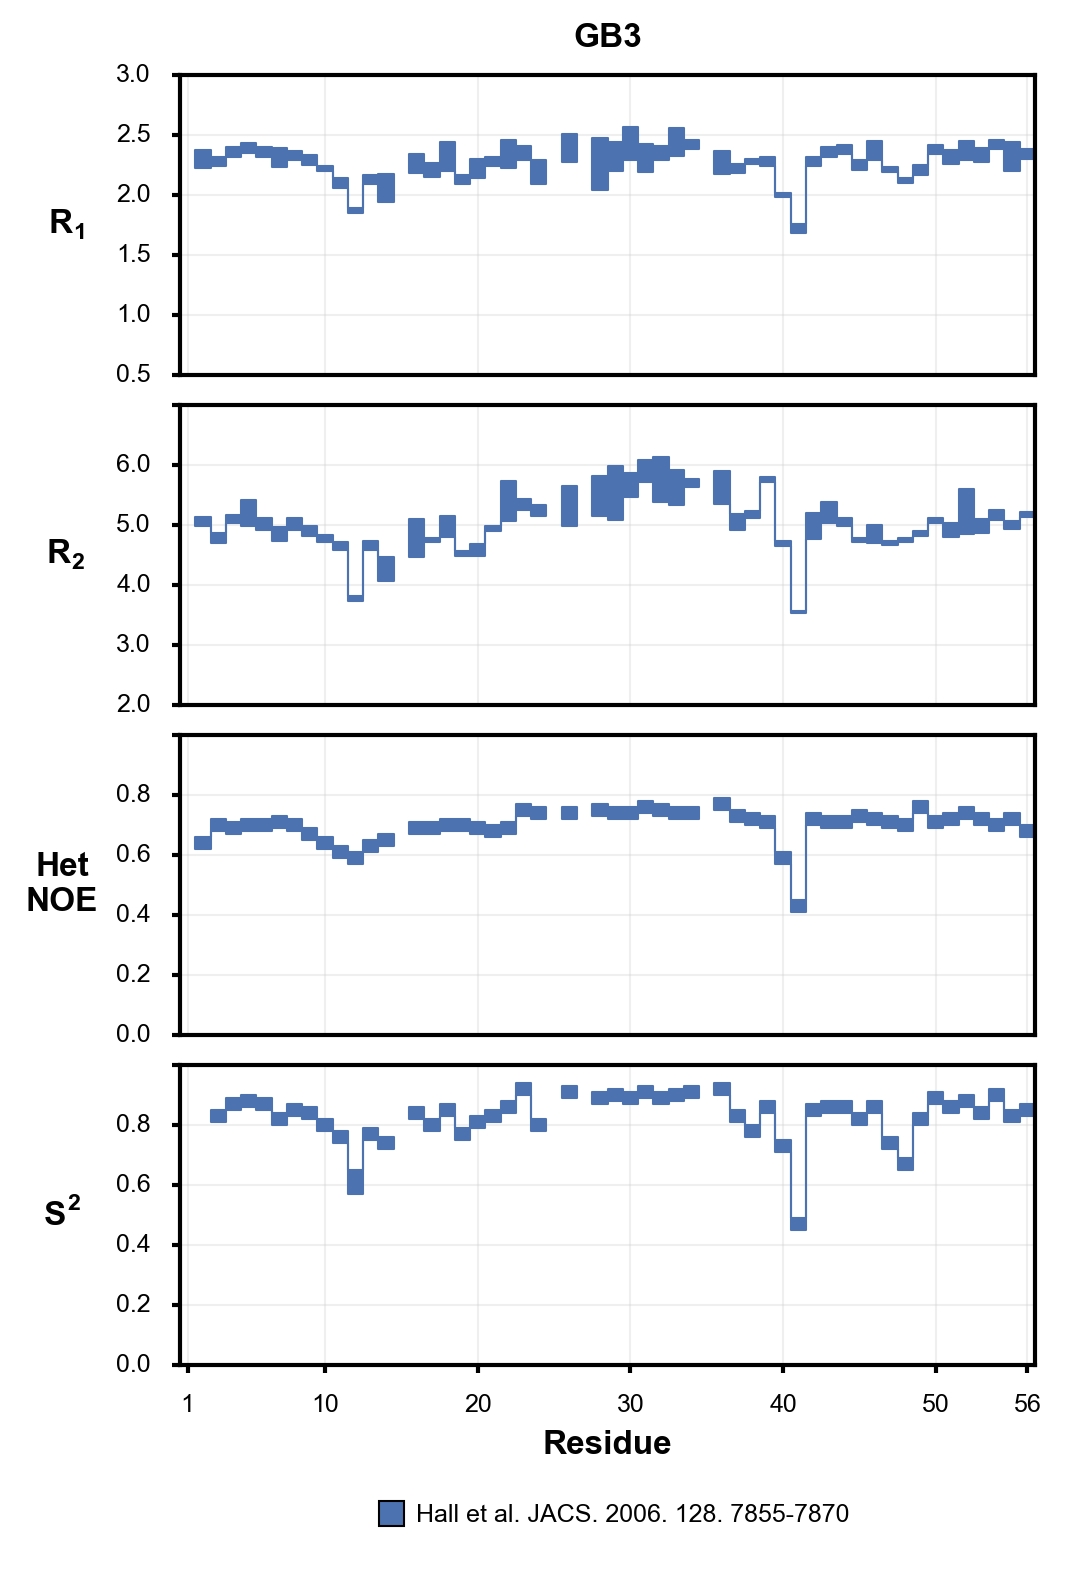
Parameters: - defaults (string, dict, optional) – Default arguments; may be a yaml string, path to a yaml file, or a dictionary; if not provided pulled from self.defaults
- args (tuple) – Additional positional arguments
- kwargs (dict) – Additional keyword arguments
StateProbFigureManager
Generates one or more state probability figures to specifications in a YAML file.
-
class
moldynplot.StateProbFigureManager.StateProbFigureManager(*args, **kwargs)¶ Bases:
moldynplot.myplotspec.FigureManager.FigureManagerClass to manage the generation of probability distribution figures
Parameters: - defaults (string, dict, optional) – Default arguments; may be a yaml string, path to a yaml file, or a dictionary; if not provided pulled from self.defaults
- args (tuple) – Additional positional arguments
- kwargs (dict) – Additional keyword arguments
-
draw_dataset(*in_args, **in_kwargs)¶ Draws a dataset.
Parameters: - subplot (Axes) – Axes on which to draw
- x (float) – X coordinate of bar
- label (str, optional) – Dataset label
- color (str, list, ndarray, float, optional) – Dataset color
- bar_kw (dict, optional) – Additional keyword arguments passed to subplot.plot()
- handles (OrderedDict, optional) – Nascent OrderedDict of [labels]: handles on subplot
- kwargs (dict) – Additional keyword arguments
TimeSeriesFigureManager
Generates one or more time series figures to specifications in a YAML file.
-
class
moldynplot.TimeSeriesFigureManager.TimeSeriesFigureManager(*args, **kwargs)¶ Bases:
moldynplot.myplotspec.FigureManager.FigureManagerManages the generation of time series figures.
Supported Presets:
Root-mean standard deviation (
rmsd):
Radius of gyration (
radgyr):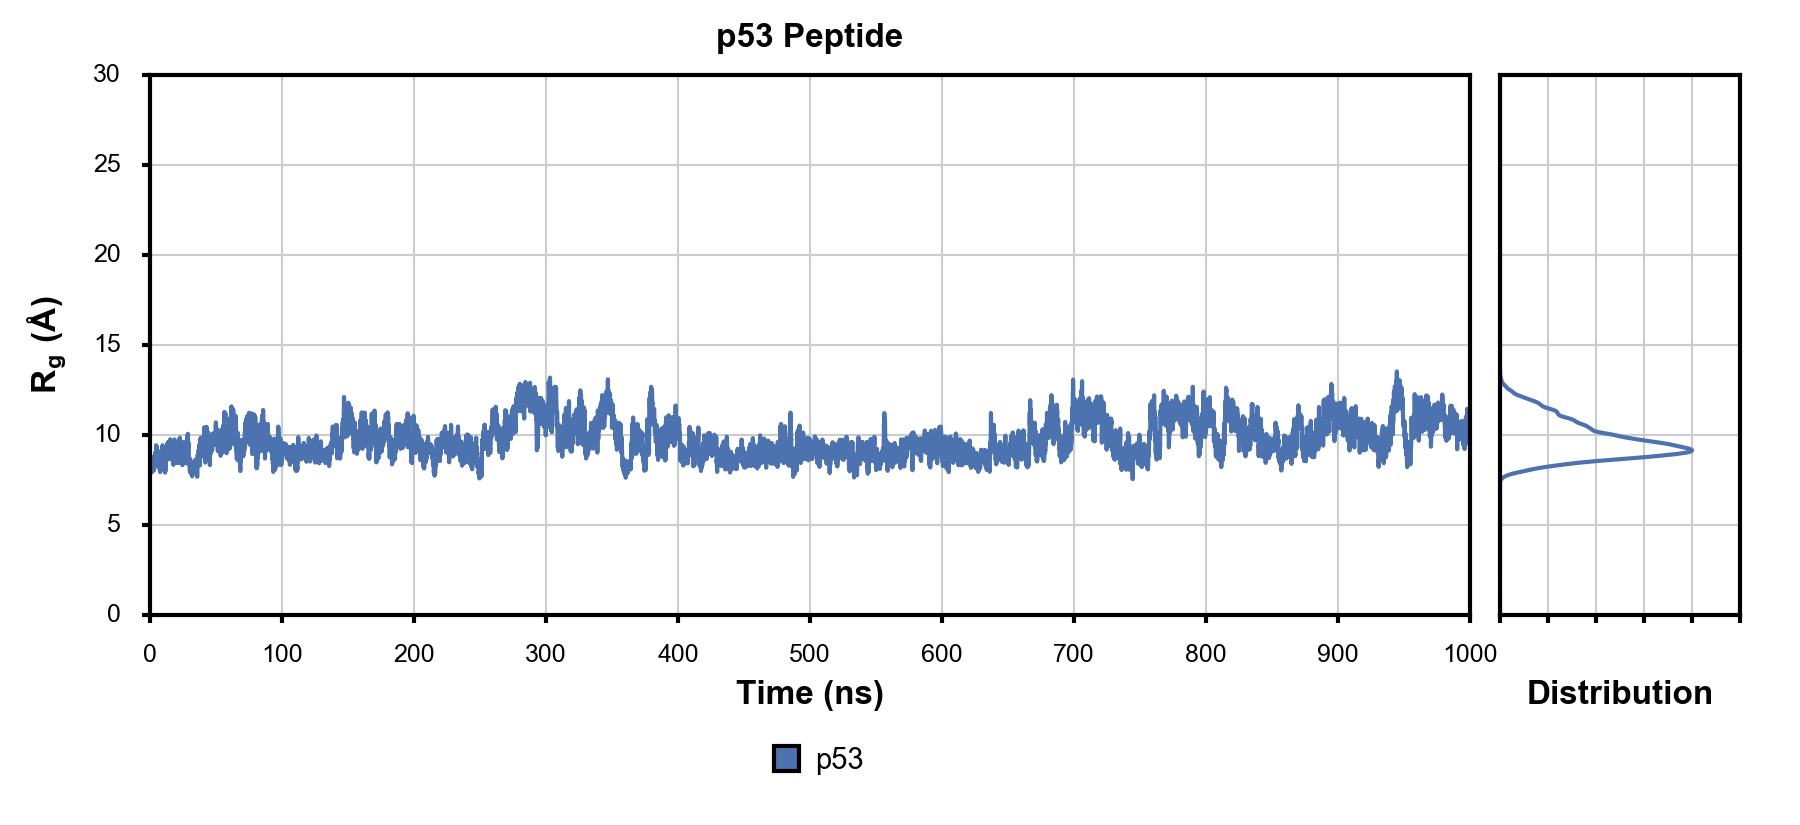
Parameters: - defaults (string, dict, optional) – Default arguments; may be a yaml string, path to a yaml file, or a dictionary; if not provided pulled from self.defaults
- args (tuple) – Additional positional arguments
- kwargs (dict) – Additional keyword arguments
-
draw_dataset(*in_args, **in_kwargs)¶ Draws a dataset on a subplot.
Loaded dataset should have attribute timeseries_df
Parameters: - subplot (Axes) –
Axeson which to draw - dataset_kw (dict) – Keyword arguments passed to
load_dataset - plot_kw (dict) – Keyword arguments passed to methods of
Axes - draw_plot (bool) – Draw plot
- draw_pdist (bool) – Draw probability distribution
- draw_fill_between (bool) – Fill between specified region for this dataset
- draw_mean (bool) – Draw point at mean value value of probability distribution
- verbose (int) – Level of verbose output
- kwargs (dict) – Additional keyword arguments
- subplot (Axes) –
TimeSeries2DFigureManager
Generates one or more 2D time series figures to specifications in a YAML file.
-
class
moldynplot.TimeSeries2DFigureManager.TimeSeries2DFigureManager(*args, **kwargs)¶ Bases:
moldynplot.myplotspec.FigureManager.FigureManagerManages the generation of 2D time series figures.
Supported Presets:
Per-residue root-mean standard deviation (
perresrmsd):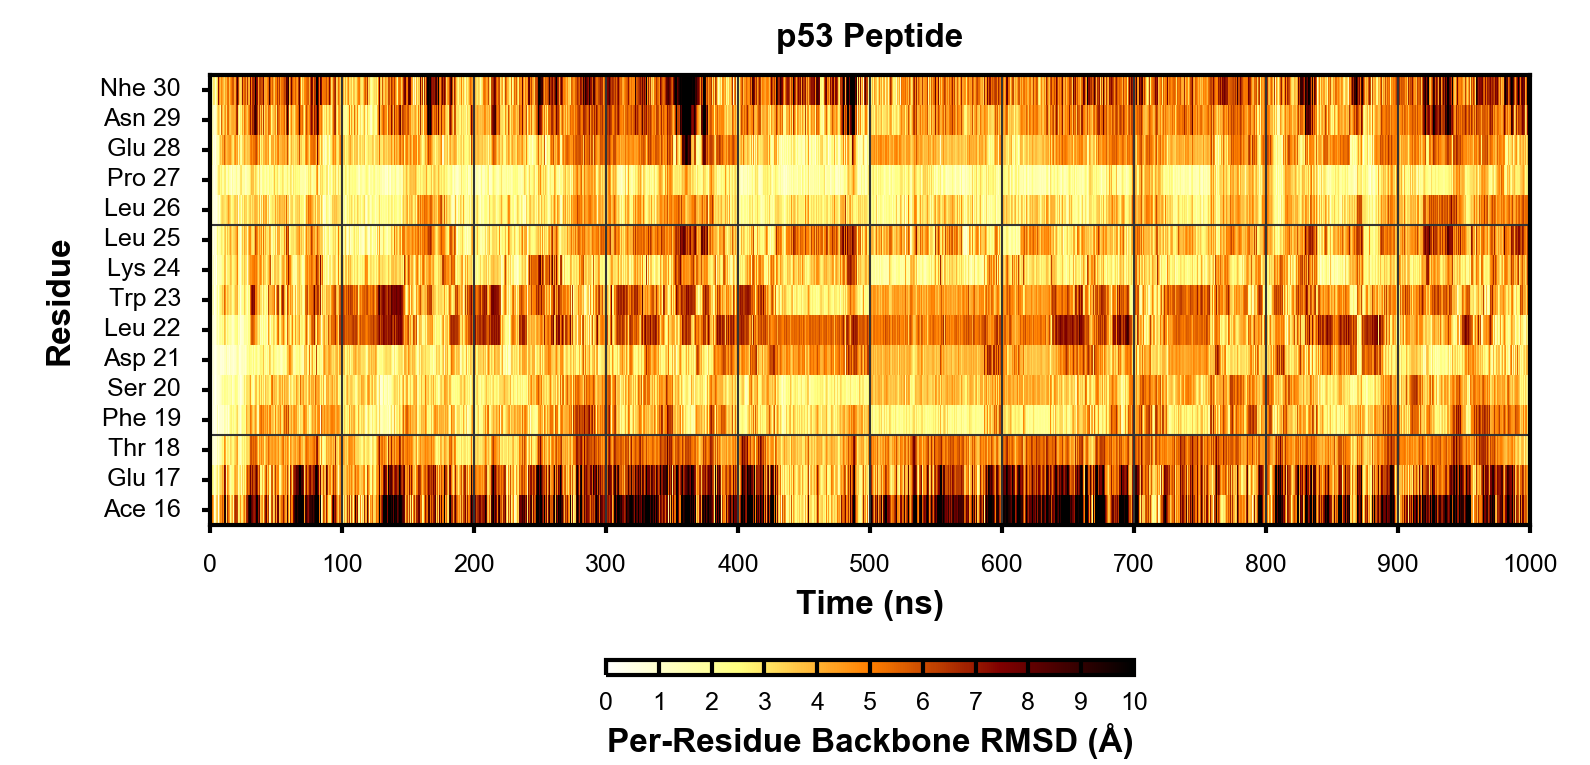
Dictionary of secondary structure prediction (
dssp):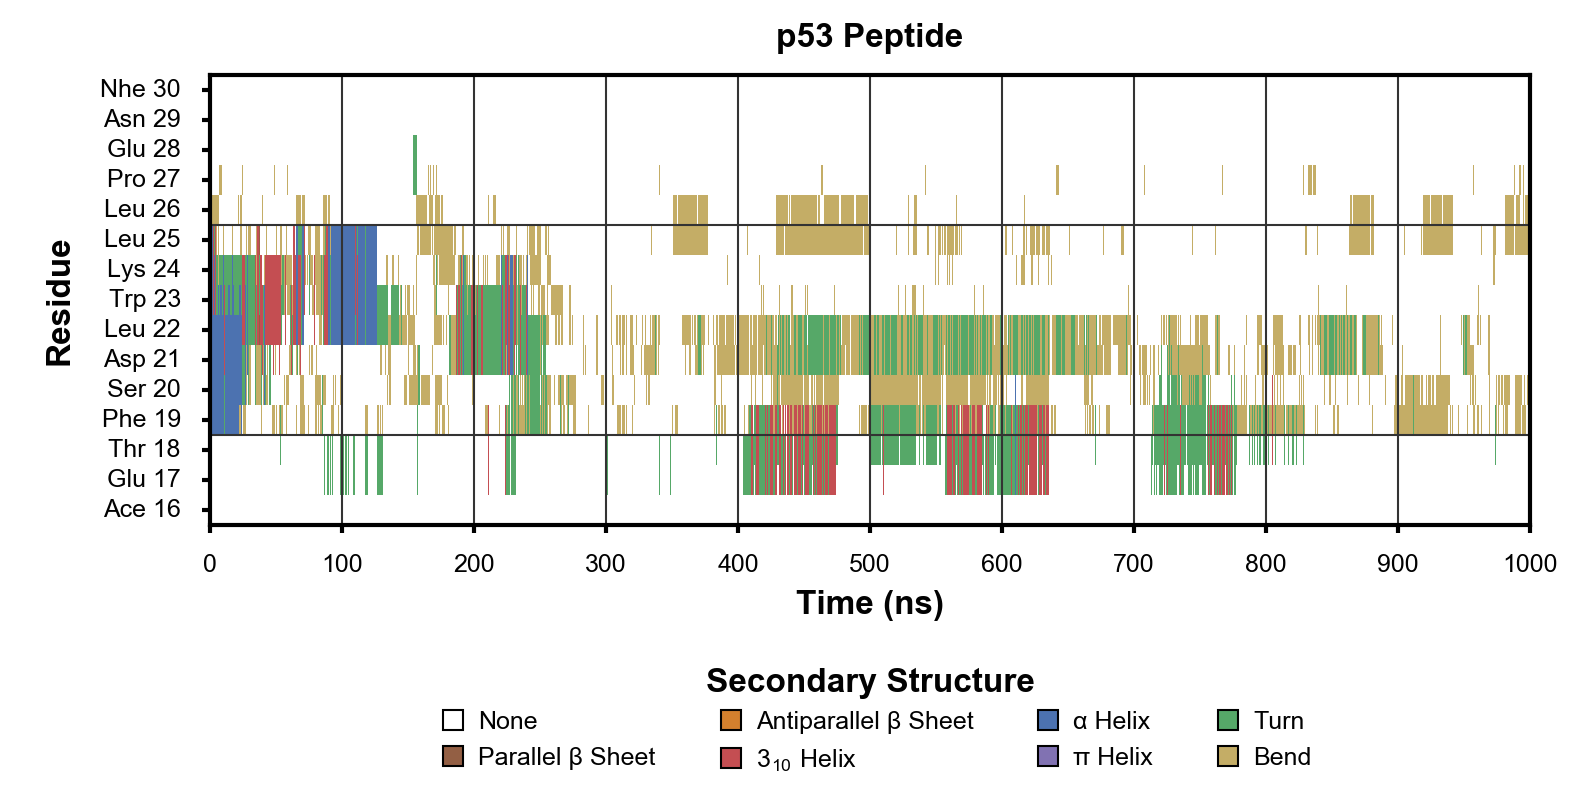
Parameters: - defaults (string, dict, optional) – Default arguments; may be a yaml string, path to a yaml file, or a dictionary; if not provided pulled from self.defaults
- args (tuple) – Additional positional arguments
- kwargs (dict) – Additional keyword arguments